Using TraceSource for Logging

How often have you been in a project and you wanted to create a simple log file to log out errors and, if debugging an annoying error, parameter and variable values? I've wanted to do this a few times but there are a handful of references out there on how best to use TraceSource for logging. Of course you have your best resources of MSDN and StackOverflow, but I figured a bit more of an understandable example would be most helpful to everyone looking on how to easily implement this to their projects.

To get started in the simplest way, all you need to do is to update the config file to include the System.Diagnostics section and then update the code you want to log out the information that you want. Below is a similar example to what is shown on the previously mentioned MSDN article.

You may have noticed that I'm calling the Flush() and Close() methods on the TraceSource object. This is done to make sure the file gets written to and is closed properly. If you aren't getting everything written to your listener, these calls may be all that's needed. However, I've seen cases where it's not always required.

TraceSource can be used across layers of the application as well and you can create a source for each of the layers to do a bit of a separated logging. So if you have a wrapper class you wouldn't want to log as much as you might a business class that has all your business logic.

Of course, if you push to production and don't want all this logging until you need it, you can turn it off per the switch inside of the specific source.

To show how it's used for different classes, I'll use a standard Person/Employee class hierarchy. So below we have our two new classes:

Fairly basic classes here with some similarly basic methods. As you can tell with the methods, I’m logging some fairly verbose information out. So if there any problems with certain data, I can just look at the logs to see what the methods are using and their return value. This can be crucial in debugging a certain item when you have a decent sized data set. If this wasn’t available you’d then have to go through each item in the data set by hand.

To separate out the log for each class or even a whole layer in your app, just create a new source for each layer you want to be logged separately. I’m using the same listener so they’ll all go to the same place, but you’re free to have each source have it’s own listener.


And now you have your information logged: 

PersonLog Information: 0 : Is John Doe valid - True
EmployeeLog Information: 0 : Is the IT department valid - True

This is just a basic use of TraceSource for logging information. I used a file to log out because I feel that it’s fairly easy to use and you have one location for all your log statements. If you’re used to log4net with the different additional appenders (listeners in terms of using TraceSource), then the Essential Diagnostics library will be a great addition to the project to further enhance using TraceSource for logging.

The full source for this example can be viewed on GitHub – TraceSourceLogging.
 

Debugger Display using ToString()

One of the things as a .NET developer that I tend to do most while debugging is to traverse through objects and their properties to see what values they have. Of course, the Base Class Library has something to help us do this even faster and more efficient – DebuggerDisplay attribute. Let’s say you’re tasked to help an insurance company write an updated application to determine the rate based off certain attributes on the car, such as age and number of collisions. It may look something like the following:

Showing regular object debugging.

And while debugging you want to see the properties, Visual Studio will show you something similar to the below.  Not bad, but we can do a bit better with the DebuggerDisplay attribute. Let’s see how this gets used. With the same class definition that we had earlier, we just add the DebuggerDisplay attribute to the class. To access any of the properties, just enclose them in “{ }”.

And our result is the below. Note that you can still expand out the object for other properties as well.

Debugging the object with DebuggerDisplay

Now, this alone can help out, but we can also run methods in the DebuggerDisplay attribute. Let’s override our ToString method of our class and use that. Note that the “nq” in the attribute is for “no quote” which will remove the quotes from the resulting string.

And, as you can see, we get the ToString() result in our debugger tool tip.

Debugging object using DebuggerDisplay with ToString()

Of course, there are other reasons why you would want to override the ToString method in your own classes, but hopefully now you know just one more way you can use it. Have fun debugging, everyone!

WinDBG Beginner Sessions: Part 1 - Hang

We got through the exhibition post, but now it’s time to get serious. I figured the quickest way to get going here is to go through Tess Ferrandez’s series of debugging labs. I’ve heard that these are actually some of the best tutorials and hands-on experience you can get with WinDBG, so I’m excited to get started.

Of course, one of the reasons I’ve waited so long to do this is due to the labs having the demo site setup in IIS. I’m definitely not the best at deploying and configuring IIS, so instead here I used IIS Express. This seems to work quite well so I’ll be sticking with that throughout the labs. So let’s get started with lab 1 – the hang.

The first part of the lab was to recreate the issue. Since TinyGet appears to be dead, I just manually hit refresh on the browser windows. While that was going I ran the following command to get a dump file while going to the page in question:

.\procdump.exe -n 2 iisexpress.exe

Unfortunately, I forgot to generate the dump using the -ma switch, so no memory information will be available. I swear to remember to use this from now on!

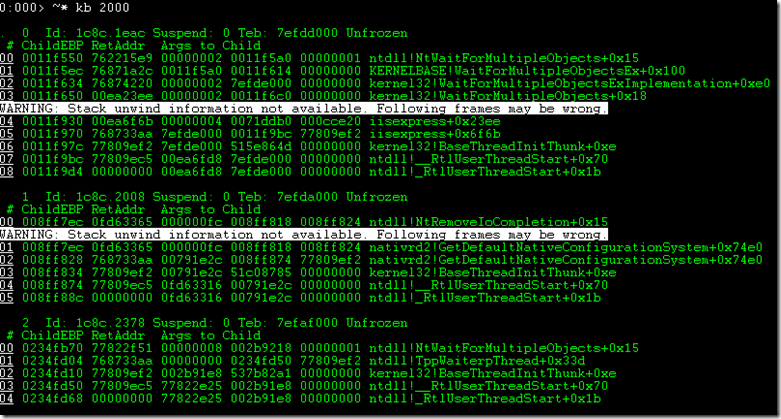
Based on the suggestion of the lab, running the ~* kb 2000 command. Ok, so after some searches, I'm still not exactly sure what this command is saying, but here's a shot in the dark:

  • ~* will execute the following command towards all threads.
  • kb will print out the native (non-.NET) call stack.
  • 2000…well, here’s where I'm lost. If anyone out there happens to know, please let me know.

And the results of this is the below. Let's see, it appears that most of these threads are just in a waiting state.

clip_image001

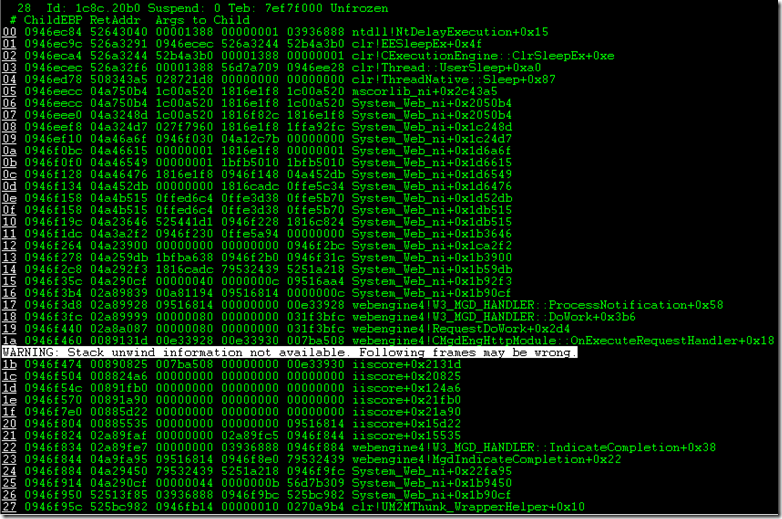
Oh, but after some scrolling, thread 28 has something interesting.

clip_image002

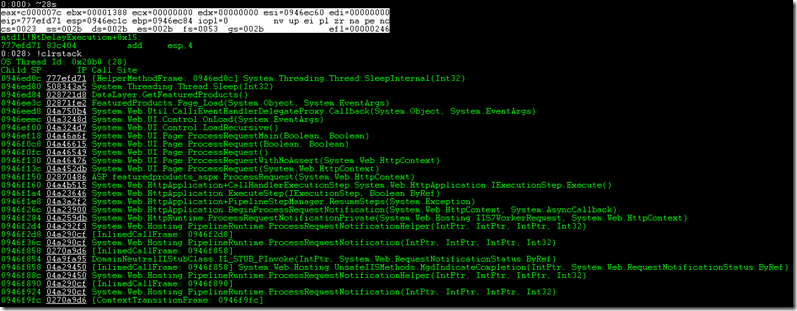
Let's take a closer look at this thread and switch the debugger to it with the ~28s command. Then, we'll check out the managed call stack with the !ClrStack command.

clip_image003

See anything here? Talk about interesting, this thread is sleeping! Well, that's about all the commands I can think to run for this. Tess' lab suggests to run the !syncblk command, however, when I ran it I get the below.

clip_image004

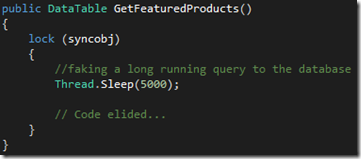
Perhaps that's due to the fact that it isn't a full dump? Regardless, I think we have more than enough information from our dump here. Now, let's check the code that the !ClrStack command has given us. It's telling us to check out the DataLayer.GetFeaturedProducts() method, so let's take a look.

And look what we have.

clip_image005

Of course, looking back at the actual walkthrough of the lab, I missed a bit without the !synblk command. I’m definitely going to redo this with an actual full dump to see if I can find the thread that is being blocked and the thread that’s doing the blocking. I got a bit lucky on this one, I think.

WinDBG Beginner Sessions: Part 0

In an earlier post where I mentioned I took a very informative training course from Wintellect, I thought I’d use this blog to help keep track of what I’ve been studying and to kind of have a bit of a “peer review” of this stuff that I’m trying to learn. Although, before beginning, we still need to set up our environment. Personally, I prefer to have a dark background with a green text, a la the old terminal days. It just seems the easiest on my eyes and easiest to read. Below is a small list of the color changes I made to my base workstation. I leave the prompt command text white so I can differentiate when I set in a command vs. any output from WinDBG.

Setting Name

Color

Background Black
Text Green
Normal Level Command Window Text Green
Normal Level Command Window Background Black
Prompt Level Command Window Text White
Prompt Level Command Window Background Black

And here is a small sample screenshot of it in action:

windbgColors

On Better Developer Testing

I read an interesting post by Phil Haack a little while ago on having developers do better testing themselves instead of relying solely on their QA team to test. While it’s definitely a great read in itself, I felt I had to add my opinion to it.


Don’t get me wrong with this, though. I think the more experience and skill a developer has on testing their own code, the more valuable they actually are. Also, it’ll mean their code is that much more reliable and stable upon initial release all the way through to production. No developer wants to find that their code somehow broke in production the morning after it was deployed and spend that whole day fixing it.


While I definitely agree with Phil on most of his arguments, there was one thought about the whole thing that kept coming to mind about myself, personally, when testing stuff that I’ve written. I know I don’t have the experience to think of a good amount of scenarios the code will be hit at. Now, this may not be an issue for the more experienced developers out there, but I know it’s a weak point of mine. I’ve definitely been bit by not doing more of this in the past and, indeed, it wasn’t fun admitting it was my fault when the manager is asking what happened. In fact, when this happened to me it gave me a very real benefit of using unit tests. Of course, unit tests can’t test everything that a user would do as input or processes on a screen. While Phil notes that Test Driven Design is mainly for the initial design of the code we’re ultimately testing, it definitely helps to make sure any refactorings for readability, maintainability, performance, etc. didn’t break anything we’ve already shown and trust to be correct.

Mastering .NET Debugging….or Trying To

For two days this week I’ve had the privilege of taking another training course from Wintellect and John Robbins (author of a still very relevant debugging book) was the instructor. Based on the title of this post, the course was on .NET debugging. I thought I’d give my thoughts on this course and my experiences with Wintellect’s training in general.


Day 1

This day was mainly focusing on debugging through Visual Studio and slightly changing your processes in how you do daily development and coding, such as more advanced breakpoints. One of the things that I didn’t quite expect to learn was about code analysis. I have used FxCop as a stand-alone tool before a few times, but now it seems that as of Visual Studio 2012 (that I’ve noticed) it’s built into the IDE. This is definitely the quickest thing to incorporate into your daily routine. Once I was back in the office turning on code analysis was the first thing I started changing. Another aspect from this day was how versatile the watch window is. I used to use the immediate window if I needed to run a quick statement, but switching to the watch window seems to be a better choice. It’s much easier to explore the object I evaluated and it’s members.


Day 2

Now this is where it was getting more fun. I’ve been interested in learning more about how to use WinDBG plenty of times in the past but, in all honesty, each time I’ve tried it’s just gotten so overwhelming that it didn’t last very long. Sure there are actually tons of resources now to help, but if you get to a point where you have no idea how the author was able to find how they got a memory address or explained how they knew how to go from one command to the other, you’re just going to get lost. With this course, however, if I got to that point, all I had to do was just ask and it was explained very clearly. That’s one of the reasons I like these so much, it’s like having your own personal mentor for a day or two. Now I feel like I have a decent understanding of at least what I can do to start doing some of this myself. Take a random memory dump and see what I can find by exploring. John even went over a few interesting items related to performance, as well.


This course definitely makes me feel much more confident in my debugging skills and I hope to use all the items learned from here to their full extent. Of course, one thing I’ve learned recently – if John Robbins tells me how to code, that’s how I’m going to code. :]