Data Anonymization

With all the news about the Cambridge Analytica scandal that has happened, there's a lot of critical discussions going on about data privacy. With that, I've found a few resources that can help us as data scientists with data anonymation and privacy.

The first one is a video by Katharina Rasch who goes over some tips on how we can anonymize data better.

Another resource comes from Microsoft. They have a course in data ethics and law. An interesting offering for a program about artificial intelligence, but an important one.

Research Minute: Useful Things about Machine Learning

I've done book reviews in the past, but as I mentioned in my post on deliberate practice, I intended to get into more research papers. I don't have any academic experience in reading research papers, I can't quite be able to reach the very math centric or abstract papers (at least not yet), but there are quite a few that, with some patience, anyone can read and learn from.

With that, I'll do my best to summarize the more interesting research papers I read here.

How to Read a Research Paper

When first getting started with reading research papers is that you don't read the whole thing in one pass through. Read a bit of the Abstract and Introduction sections to make sure it's a paper that looks interesting.

For more on how to read a research paper, Siraj Raval has an interesting video:

A Few Useful Things to Know about Machine Learning

For this first Research Minute, I chose the paper A Few Useful Things to Know about Machine Learning by Pedro Domingos from the University of Washington. This paper has some very practical thoughts on creating your machine learning models. Below are a few of the ones I found the most helpful.

Generalizing of the model is what matters most

This is the main reason you create a model, but often times you won't have any true test data from the wild to test on. Because of this it is recommended to split your data even before you do any pre-processing on it. scikit-learn has a very handy test_train_split method just for this purpose.

What we're trying to avoid is overfitting your model (which we explore a bit later in this post). An overfit model won't give you accurate results if you deploy it and it predicts with real data that it hasn't seen before when the model was trained.

You need more than just data

The author puts this very nicely that doing machine learning is a lot of work. It's not magic that we just give it data and you're done. There's a lot more to it than that. A good analogy from the paper is that creating machine learning models is like farming. Nature does a good bit of the work, but a lot of up-front work has to be done for nature to do its thing. It's the same way with creating machine learning models - a lot of pre-processing and business understanding of the data is needed before starting the modeling process.

It's often said that most of the work in data science and machine learning is cleaning and getting your data in a state that you can feed it into a model and also to evaluate how your model's performance does. Fitting data into a model is easy with the current libraries.

Be aware of overfitting

Overfitting a model is where the model will score high on training data, but when it sees real data that it hasn't yet seen, it will score low. Ways in which overfitting happens is with bias and variance.

Bias is where the algorithm learns the same wrong thing, which results in the model missing relevant relationships. Recall my previous post about how bias in machine learning is a big topic that we still need to work on. Variance is where the model is sensitive to irrelevant data which can cause it to model random noise in the training data.

A popular way to battle against overfitting is to use cross validation) on your model. Cross validation will take your data and create subsets of it. In each subset it will take a random portion of the data as test data. It does this with each iteration, or fold, and it compares each score of the sampled test data of all iterations. This is a good way to test your model on different data to make sure you get consistent scores. If you don't, then your model may be sensitive to part of the data.

The image below from the article helps explain bias vs. variance through the game of darts.

Prioritize feature engineering

Sometimes the best way to get a more accurate model is to do feature engineering on your data. This combines or manipulates columns of your data to create columns of new or a different type of data which may be better for the algorithm to detect a pattern. The author states in this paper that feature engineering is the best thing you can do to increase the accuracy of your model. Though, it is a tough thing to learn and there's a book strictly about feature engineering coming out soon.

Feature engineering is tricky. In the book mentioned above, doing feature engineering on your data is more like an art than it is a science. You have to know a lot about your data and have the creativity to think that unrelated parts of data can come together, or that one part of the data can be represented in a different way.

More data over a more complex algorithm

The author points out here in the paper that there can be a tradeoff of three elements when training a model - the amount of data, computational power, and the time it takes to train athe model. The author then goes into how the most important of those three is the time. Since time is a resource we can never get back or improve upon, unless we can invent the time machine, we need to choose algorithms that generalize well to our data as well as being able to be trained quickly. The best way to get both is to use more data with the simplest algorithm possible.

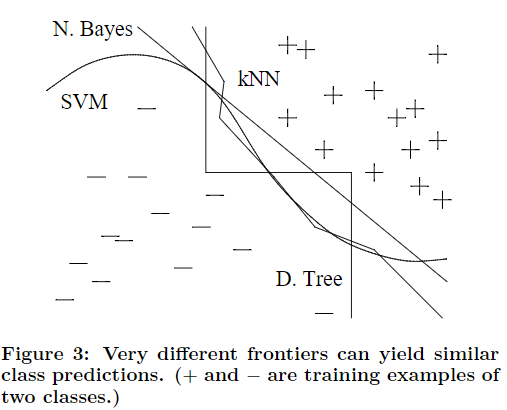
Wouldn't more complex algorithms generalize better than simpler algorithms? Not necessarily. Take a look at the below image from the paper. Multiple algorithms, some more complex than the others, still can generalize the same as the simpler algorithms. However, these simpler algorithms can be much faster to train and predict on new data.


The paper has several more ideas, thirteen in total, but these are the ones I thought gave the most insights from the projects I've done. I'm sure I'll come back to this paper several times as I do more projects and gain more machine learning experience.

Bias in Machine Learning

You hear a lot about machine learning and how it's transforming industries, but there may be something about these algorithms you may not have heard - its biases.

A bias is favoring one group over the others and these machine learning algorithms are supposed to prevent decisions based on any type of bias a person would have. However, the machine learning models are only as good as the data that you give it. The historical data that we have has a built in bias that we need to address.

I came across an interesting talk from the 2017 NIPS conference that goes over this very well.

There's also an interesting podcast episode of the TED Radio Hour that goes over algorithmic bias.

Researchers know this is a problem in algorithms and they are actively doing research on how to better beat these biases from machine learning models. Until then, though, we would need to be diligent when testing our models to make sure these types of biases aren't integrated in our data.

Getting Up and Running with FsLab for Data Science

FSAdvent time is back this year! I'm going to use this post to start a new work in progress series on using F# for Dara science. This series will mainly consist of using FsLab to manipulate and visualize data.

Setting Up Your Environment

The easiest way to get setup in the IDE of you choosing is to just download the basic template of FsLab. This just references FsLab with Paket and gives a small script example. That's perfect for all that we need to do.

We're going to go through the script that it provides (with a bit of changes) in this post. Don't worry though, we'll go through a good bit of different aspects of the script in future posts. We're just getting up and running here as sometimes that can be the biggest hurdle to get started in something new.

Generating Data

FsLab comes with the FSharp.Data package which includes a few very useful type providers which help provide a safe and easy way to get data from external sources.

World Bank Type Provider

As previously mentioned, FSharp.Data comes with a few very useful type providers. One that we'll use here to help give us some real world data is the World Bank type provider. You could spend all day looking at what data it provides. For this post, though, we'll look at the US and EU percent added to their GDP from industry.

Setting Up Script

Before we can access the World Bank type provider, though, we need to set up our script to access it. If you used the basic template it will already have FsLab setup with Paket so you would just need to run paket.exe install or build the project.

Now we can reference FsLab so first thing to do is to load the script to access everything we need from it:

#load "packages/FsLab/FsLab.fsx"

Now that we have the FsLab script loaded we can access all sorts of libraries from it by using the 'open' keyword in F#.

open Deedle
open FSharp.Data
open XPlot.GoogleCharts
open XPlot.GoogleCharts.Deedle

We have a few external libraries we're using throughout our script:

  • Using Deedle to explore our data.
  • The FSharp.Data library for our World Bank type provider.
  • GoogleCharts and GoogleCharts.Deedle to visualize our data.

Getting Our Data

Next we instantiate the World Bank type provider and from there we get a reference to the Indicators object for the US and for the EU.

let wb = WorldBankData.GetDataContext()

let us = wb.Countries.``United States``.Indicators
let eu = wb.Countries.``European Union``.Indicators

From there we get the industry percent value added to the country's GDP and create a data series.

let usSeries = series us.``Industry, value added (% of GDP)``
let euSeries = series eu.``Industry, value added (% of GDP)``

Now here is where some work on the data happens.

abs (usSeries - euSeries)
|> Series.sort
|> Series.rev
|> Series.take 5

From here we get the absolute value of the difference of the two series, sort it, get the reverse of it, then take only the first five items. Looks like a bit, but we'll go into details of certain statistics for data science in future posts.

Charting Our Data

Now that we have the data we want, let's chart it. The charting library in FsLabs will allow us to customize the chart as we see fit for visualizing. For this there is an Options type that we can create. We'll just give a title and tell the legend to appear at the bottom.

let options = Options ( title = "% of GDP value added", legend = Legend(position="bottom") )

Now we just need to tell the charting library to chart our data.

[ usSeries.[2000 .. 2010]; euSeries.[2000 .. 2010] ]
|> Chart.Line
|> Chart.WithOptions options
|> Chart.WithLabels ["US"; "EU"]

We give it our data as an F# list, tell it to create a line chart, give it our options, and then tell what our labels are for our legend.

Executing

Just run it all in F# Interactive. :)